How to Use Chi Square Test on Raw Data
By Marco Wong
(Biology & Chemistry Tutor)

In IB biology internal assessment, there are three acceptable categories:
- Hand-on practical experiment
- Database analysis
- Computer simulation or modeling
Although they have a fundamental difference in practice, all of them require student’s analytical skills in handling raw data. Depending on the nature of the research question, the sources of data and the sizes of data can differ, ultimately, one should organize the data in numbers, tables or graphs.
One of the most important analytical methods is to use the chi-square test for correlation. Although it is taught Ecology, it does not limit to just that topic, any result that concerns frequency would be suitable for it. Examples like the “seedling’s height in 7 days to the size of the seed” could be deduced with chi-square.
Step 1 Construct a frequency table
A frequency table is a must for chi-square test, it should show the total number of each occurrence and co-occurrence. If your data are continuous in nature (e.g. height of seedling), a cut-off line should be used to group them. Remember, what you are observing is the frequency of occurrence, not the amplitude.
|
Sprout height ≥ 5cm |
Sprout height < 5cm |
|
|
Seed ≥ 0.2g |
41 | 9 |
|
Seed < 0.2g |
13 | 37 |
From the data-table, one of the conditions should be the dependent variable and the other should be the independent variable.
Step 2 Calculate Chi square value
To calculate the chi-square value, the expected result is needed. Usually, we use the null hypothesis, which we expect the results to be in normal distribution (true random). In the table above, expected value should be the total number of cases divided by the number of possibilities. That is 25 for all cells.
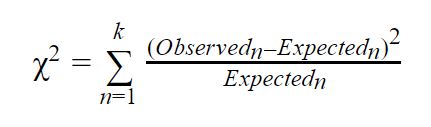
This might be difficult to handle but don’t forget you can use excel and google sheet to make your life easier. Our chi-square value is 31.562.
Step 3 Find the p-value
Once you get the chi-square value done, you will need to use p-value, which represents the significance of the correlation between your variables. The p-value depends on the “degree of freedom”(df), which is (Row – 1)x(Column – 1). In our case of mung beans, it is 1.
Search up a chi-square p-value table, and compare your results to the p>0.05 value of d.f. =1.
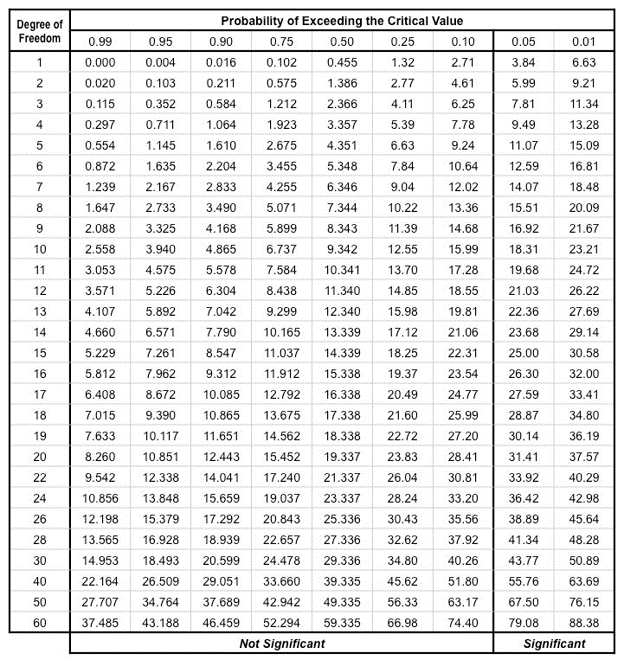
Step 4 Conclusion
Looking at the result you have, if your chi-square value is larger than the p>0.05 value, congratulations, the two variables are significantly related and not by just chance!
Remarks
Chi-square test does not prove any causative relationship, and the conclusion one gets from it is usually for association of two phenomena only. Picking a median and dividing the data into two groups is called a median-test.
About The Edge
The Edge Learning Center is Hong Kong’s premier Test Preparation, Academic Tutoring, and Admissions Consulting services provider. Founded in 2008, The Edge has helped thousands of students improve their ACT and SAT scores as well as their IB and AP grades. The AC team has just finished off another successful period in which students gained acceptance to schools such as Columbia, Yale, UChicago, and more! Check out our latest Admissions Results!
